Real time monitoring of .NET web applications with logstash, elasticsearch and Kibana
- logstash
- elasticsearch
- kibana
- windows
- elk
- iis
Intro
This is a quick run-through of configuring logstash, elasticsearch and Kibana (the ELK stack) on Windows to create a real time monitoring solution for your web application. It took me around 2 hours to get this setup the first time while following this excellent blog.
I won’t go into the detail which this blog has done, so expect some short, sweet bullet points. Then we’ll create some visualizations (pretty pictures) from the basic IIS logs, which could help identify problems with your web application.
Summary of tools
-
logstash - used to process unstructured data (e.g. logs) from various sources into structured, readable keys and values which will be pushed to elasticsearch where they can later be queried. Simply tell logstash where your logs are, how to transform the unstructured data into something structured and where your elasticsearch instance is running. The structured output will be forwarded to elasticsearch.
-
elasticsearch - store and search large amount of structured, unstructured and time-series data.
-
Kibana - visualize your data from elasticsearch.
Prerequisites
- Java. It’s required for logash. It also must be on your path.
- Grab it from Oracle’s website if you need it.
- Follow instructions on this Stack Overflow answer if you’re not sure how to add Java to your path. You’ll want to add:
- Variable:
JAVA_HOME - Value:
C:\Program Files\Java\jdk1.8.0_45
- Variable:
Setup
Head over to https://www.elastic.co/downloads.
Download:
Extract each zip to a common folder (I’ve called mine “monitoring”). You should end up with something like:
C:\monitoring\logstashC:\monitoring\elasticsearchC:\monitoring\kibana
logstash
First, some explanation. We want to take a standard log line from a web application running on IIS, which looks like…
2015-07-09 09:21:32 ::1 POST /WebApplication/Claims/1 - 80 - ::1 Mozilla/5.0+(Windows+NT+6.1;+WOW64)+AppleWebKit/537.36+(KHTML,+like+Gecko)+Chrome/43.0.2357.132+Safari/537.36 200 0 0 84
…and push it to elasticsearch in a structured manner. There’s a few ways to extract this information. In this example, it’s being done by matching the order which the terms appear. It’s important to specify the types here to have full searching power later on. You don’t want everything being a string!
To strip out the detail and specify types, we’ll need to tell logstash how to interpret it. Introducing grok, which works by combining text patterns into something that matches your logs. There are currently over 120 patterns to match against.
So, here is our grok filter, which is added to the logstash config.
match => ["message", "%{TIMESTAMP_ISO8601:log_timestamp} %{IPORHOST:site} %{WORD:http_method} %{URIPATH:page} %{NOTSPACE:query_string} %{NUMBER:port} %{NOTSPACE:username} %{IPORHOST:client_host} %{NOTSPACE:useragent} %{NUMBER:http_response} %{NUMBER:sub_response} %{NUMBER:sc_status} %{NUMBER:time_taken}"]
You’ll note the first part of the filter is {TIMESTAMP_ISO8601:log_timestamp} which is simply stating the type followed by a term to identity the matched value by. When you look back at the example log line, you’ll see the first value is 2015-07-09 09:21:32 which is a timestamp. Simples!
Below is a full config file which you can use for the standard IIS log format. It will extract the values as explained above and push them to elasticsearch. Copy the config (and amend it to your needs) to a new file and name it logstash.conf. Save it to your logstash bin folder C:\monitoring\logstash\bin.
input {
	file {
		type => "IISLog"
		path => "C:/inetpub/logs/LogFiles/W3SVC*/*.log"
		start_position => "beginning"
	}
}

filter {

	# ignore log comments
	if [message] =~ "^#" {
		drop {}
	}

 	# check that fields match your IIS log settings
	grok {
		match => ["message", "%{TIMESTAMP_ISO8601:log_timestamp} %{IPORHOST:site} %{WORD:http_method} %{URIPATH:page} %{NOTSPACE:query_string} %{NUMBER:port} %{NOTSPACE:username} %{IPORHOST:client_host} %{NOTSPACE:useragent} %{NUMBER:http_response} %{NUMBER:sub_response} %{NUMBER:sc_status} %{NUMBER:time_taken}"]
	}

	# set the event timestamp from the log
	# https://www.elastic.co/guide/en/logstash/current/plugins-filters-date.html
	date {
		match => [ "log_timestamp", "YYYY-MM-dd HH:mm:ss" ]
		timezone => "Etc/UCT"
	}

	# matches the big, long nasty useragent string to the actual browser name, version, etc
	# https://www.elastic.co/guide/en/logstash/current/plugins-filters-useragent.html
	useragent {
		source=> "useragent"
		prefix=> "browser_"
	}

	mutate {
		remove_field => [ "log_timestamp"]
	}
}

# output logs to console and to elasticsearch
output {
	stdout {}
	elasticsearch {
		host => "localhost"
		protocol => "http"
		port => 9200
	}
}
Now all we need to do is start the logstash process and it will monitor any location(s) specified in the input section of the config.
cd C:\monitoring\logstash\bin
logstash.bat agent -f logstash.conf
Now, once elasticsearch is running, any new log lines will now be pushed there in a nice format!
elasticsearch
Open a command prompt and navigate to the bin directory for elasticsearch.
cd C:\monitoring\elasticsearch\bin
As a one off, you’ll need to run the install command.
service install
To start the elasticsearch process, simply execute the following:
service start
That’s it! elasticsearch should now be running at http://localhost:9200. Hit that and you should get a nice json response to let you know that the service is running.
If you need to stop the process, simply execute:
service stop
If you need any more information you can check out the official docs on the elastic website.
Kibana
The simplest one!
cd C:\monitoring\kibana\bin
kibana.bat
That’s it! There is a config file in the bin directory, but the defaults should suffice for now. Kibana should availble at http://localhost:5601.
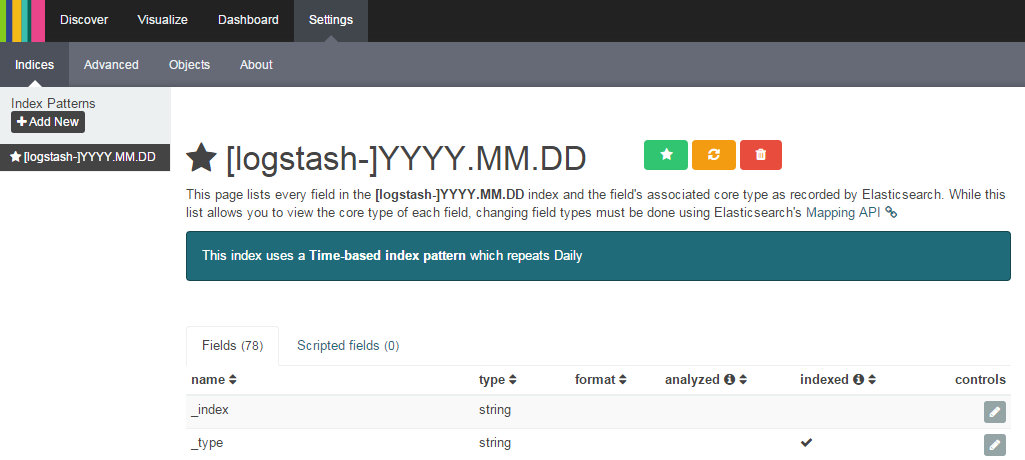
You’ll need to have a few logs in elasticsearch to complete the Kibana setup. When you first open Kibana you’ll be taken to a settings page titled “Configure an index pattern”. Check the checkbox “Use event times to create index names”. As we’re using elasticsearch, the defaults should be fine and you should be able to click “Create”.
Create some useful graphs
The basic IIS logs contain some useful data, like http response code, response time and the requested URI. This should give enough information to identity some problems in our web application. We could easily tell if response times are more than a second or we’re getting lots of 404s, 500s, etc.
Some examples below. You can see the filter criteria I have used in the left pane.
http response codes
browser breakdown
Can’t find your terms? They’re probably cached by Kibana.
- Click “Settings”
- Select your index
- Click “Reload field list” (the yellow button)